
FREE UK RESELLER TOOL
Stock Turnover Calculator
Calculate how quickly your inventory is turning back into sales and estimate how long your money is typically tied up in stock.
Enter your opening stock, closing stock and cost of goods sold for the period to measure your stock efficiency and identify potential opportunities to free up working capital.
Stock Turnover Calculator
Measure how efficiently your stock is moving and how long your capital is typically held in inventory.
Enter the cost value of your inventory at the beginning and end of the period.
Enter the cost of the stock you actually sold during the same period.
We calculate your average inventory, turnover during the selected period, annualised turnover and approximate stock holding time.
If you enter one, three or six months of data, SellerStack converts the turnover rate to an annual equivalent so different periods are easier to compare.
Enter your stock and cost of goods sold to measure how quickly your inventory is turning over.
Calculate Your Stock Turnover
Your result will show how frequently your average inventory turns over and what that could mean for your stock efficiency.
How Long Is Your Money Tied Up?
Calculate your turnover to see approximately how long capital remains invested in your average stock holding.
What If Stock Turned in 90 Days?
At the same annualised cost of goods sold, an average 90-day stock holding would require approximately:
Calculate your current turnover to compare it with the 90-day scenario.
Stock turnover shows how efficiently money invested in inventory is moving through your reselling business. Use the calculator above to measure your annualised turnover rate, estimate how long stock is typically held, and spot where too much capital may be sitting in inventory.
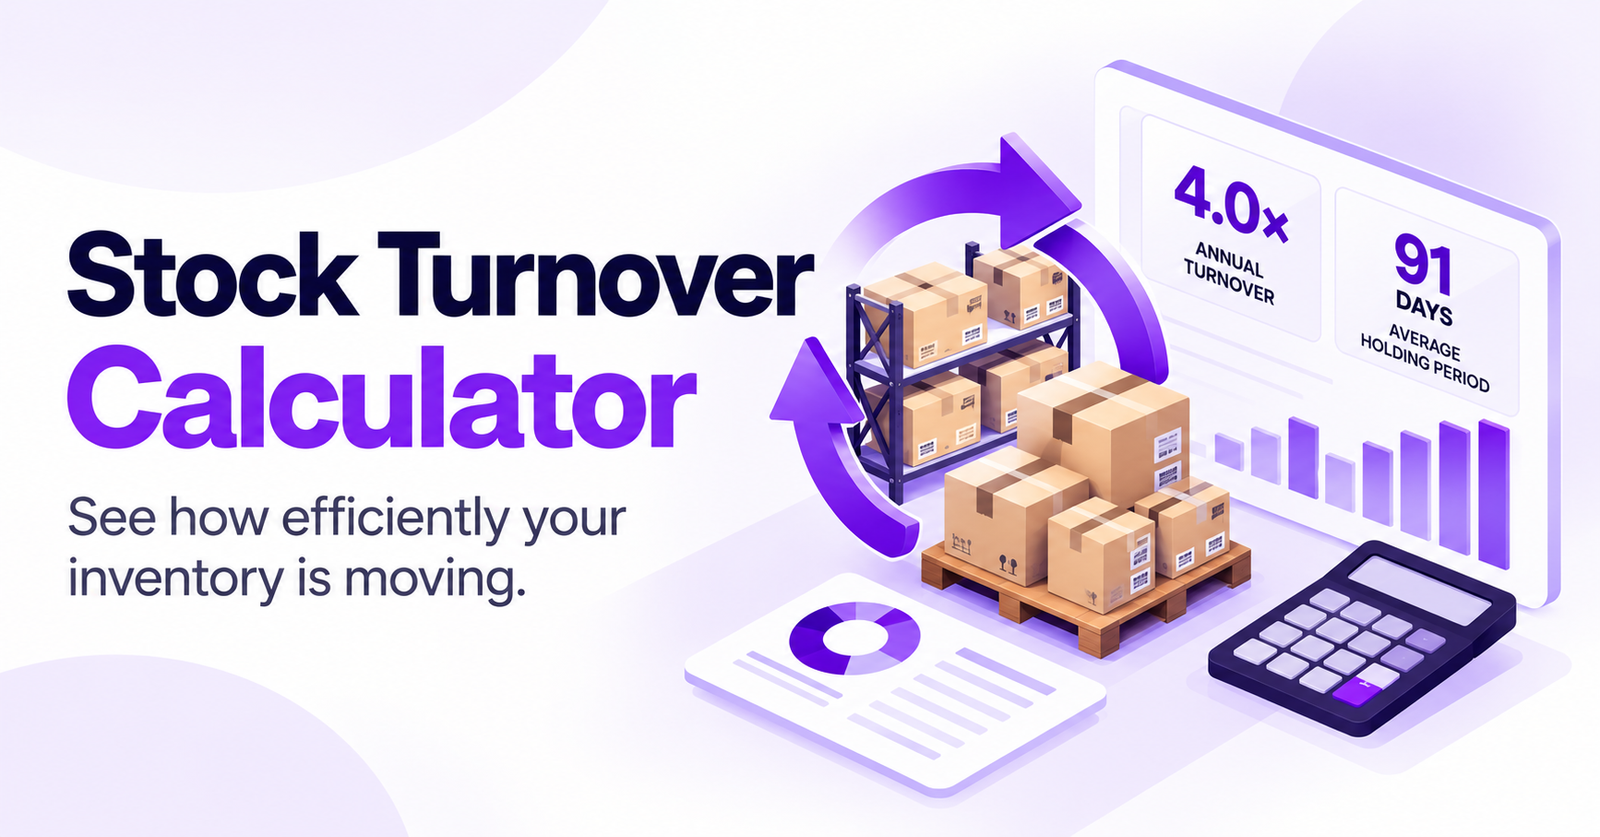
Stock turnover measures how many times your average inventory is sold during a period. A turnover rate of 4× per year means the equivalent of your average stock holding is sold roughly four times a year — an average holding period of about 91 days.
What Is Stock Turnover?
Stock turnover measures how quickly a business sells the inventory it holds. For resellers, it is a useful way to understand how efficiently money invested in stock is moving back through the business.
A stock turnover rate of 4× per year, for example, means the equivalent of your average inventory value is sold roughly four times during a year.
SellerStack also converts your annualised turnover rate into an estimated average stock holding period. At 4× turnover, that works out at approximately 91 days.
The aim is not simply to sell every item as quickly as possible. Good inventory management balances selling speed, profit margin, stock availability and the amount of money tied up in unsold products.
How to Use the Stock Turnover Calculator
You need three financial figures covering the same measurement period. For a meaningful result, use the cost value of your inventory rather than its expected selling value.
-
Enter your opening stock value.
This is the cost value of the inventory you held at the beginning of the period. -
Enter your closing stock value.
This is the cost value of inventory remaining at the end of the same period. -
Enter your cost of goods sold.
Include the cost of the products actually sold during the period — not the revenue received from customers. -
Select your measurement period.
Choose 1, 3, 6 or 12 months to match the figures you entered. -
Calculate and review the result.
SellerStack will show your period turnover, annualised turnover, average holding days and stock-efficiency guidance.
If you bought an item for £20 and sold it for £50, its contribution to cost of goods sold is £20 — not £50. Entering revenue instead of product cost can substantially overstate your turnover rate.
Stock Turnover Formula
The calculation compares the cost of products sold with the average amount of inventory held during the same period.
Calculate Average Inventory
Average Inventory = (Opening Stock + Closing Stock) ÷ 2
Calculate Stock Turnover
Stock Turnover = Cost of Goods Sold ÷ Average Inventory
Estimate Average Holding Days
Average Holding Days = 365 ÷ Annualised Stock Turnover
If you enter less than 12 months of data, the calculator annualises the turnover rate. This gives you a common yearly reference point while still displaying the turnover achieved during the period you entered.
Stock Turnover Example for a Reseller
Reseller With £4,500 Average Inventory
Suppose a reseller starts the year with £5,000 of inventory at cost and finishes the year with £4,000.
During that year, the cost value of the products sold is £18,000.
- Opening stock: £5,000
- Closing stock: £4,000
- Cost of goods sold: £18,000
- Measurement period: 12 months
Average inventory:
(£5,000 + £4,000) ÷ 2 = £4,500
Stock turnover:
£18,000 ÷ £4,500 = 4.00× per year
Average stock holding period:
365 ÷ 4 = approximately 91 days
In practical terms, the equivalent of this reseller’s average stock holding turns over approximately four times each year.
What Is a Good Stock Turnover Rate for Resellers?
There is no single turnover rate that every reseller should target. Product category, margins, sourcing model, seasonality and selling strategy can all change what makes sense.
A reseller dealing in high-margin collectibles may deliberately hold stock much longer than somebody selling frequently replenished everyday products.
SellerStack therefore uses broad planning bands to help interpret the calculator result rather than treating them as universal accounting or industry standards.
| Annual Turnover | SellerStack Rating | What It May Indicate |
|---|---|---|
| Under 1× | Very Slow | Significant capital may remain tied up in inventory for long periods. |
| 1–2× | Slow | Review ageing stock, purchasing levels and whether slower items justify the capital being used. |
| 2–4× | Moderate | Stock is moving, but there may still be opportunities to improve inventory efficiency. |
| 4–8× | Healthy | Inventory is generally moving efficiently under SellerStack’s broad reseller planning benchmark. |
| 8×+ | Fast | Inventory is moving quickly. Check that availability and profit margins remain strong. |
Do Not Judge Turnover in Isolation
A slower turnover rate is not automatically bad, and fast turnover is not automatically good. Consider the result alongside profit margin, ROI, selling costs, return rates, stock availability and the amount of work required to generate each sale.
Why Stock Turnover Matters for Resellers
Inventory consumes cash before it produces cash. If you spend £2,000 sourcing products, that money cannot normally be used to buy other stock until enough of those products sell.
This becomes increasingly important as a reselling business grows. A seller can appear profitable while still having limited cash available because a large proportion of their money is sitting in unsold inventory.
Monitoring turnover helps you see whether your purchasing and selling activity are staying reasonably balanced.
It also represents money that could potentially have been used to source another profitable product. That is why the calculator shows both turnover and estimated average holding days.
How to Improve Slow Stock Turnover
If your turnover is slower than you would like, buying more inventory is rarely the first problem to solve. Start by understanding what is already sitting in stock and why it has not sold.
- Identify listings that have remained unsold significantly longer than your normal selling cycle.
- Check whether slow-moving products are priced realistically against current demand.
- Improve weak titles, photographs and descriptions before automatically cutting the price.
- Consider sensible offers, bundles or controlled discounts for genuinely ageing inventory.
- Stop repeatedly sourcing product types that consistently take too long to sell.
- Direct more sourcing capital toward products with a proven combination of demand, margin and acceptable selling speed.
Stock Turnover vs Profit Margin
Stock turnover tells you how quickly inventory moves. It does not tell you whether those sales are profitable.
Imagine one reseller turns inventory eight times per year but earns very little profit on each sale. Another turns inventory four times per year while achieving much stronger margins. The faster seller is not automatically running the stronger business.
Turnover therefore makes more sense when considered alongside profit per item, return on investment and the time required to source, prepare, list, pack and dispatch products.
Strong inventory usually combines acceptable selling speed with worthwhile profit rather than maximising turnover or margin at the expense of everything else.
Common Stock Turnover Mistakes
- Using sales revenue instead of COGS. Stock turnover normally uses the cost of the products sold, not the amount customers paid.
- Valuing inventory at selling price. Opening and closing stock should use a consistent cost-value basis.
- Mixing measurement periods. Your opening stock, closing stock and COGS should relate to the same period.
- Assuming faster is always better. Very fast turnover can sometimes accompany weak margins or insufficient stock availability.
- Ignoring individual dead stock. A reasonable overall turnover figure can hide individual products that have barely moved.
Use Stock Turnover With Your Other Seller Numbers
Stock speed is only one part of inventory performance. Combine it with profit, ROI and break-even calculations to get a clearer view of whether your sourcing decisions are producing worthwhile returns.
Reseller Profit Calculator
Calculate how much profit remains after your buying and selling costs.
Calculate ProfitBreak-Even Calculator
Find the minimum selling price needed to recover your costs.
Find Break-Even PriceExplore All Free Seller Calculators
Use SellerStack tools for marketplace fees, pricing, profit, ROI, shipping, tax and other everyday reselling decisions.
Browse Tools & CalculatorsStock Turnover Calculator FAQs
What does stock turnover mean?
Stock turnover measures how many times your average inventory is sold during a particular period. A higher number generally means inventory is moving more frequently.
Should I use sales revenue or cost of goods sold?
Use cost of goods sold. If an item cost you £25 and sold for £60, the COGS contribution to the turnover calculation is £25.
Should stock be valued at cost or selling price?
Use a consistent cost-value basis for opening and closing inventory. Do not use the total amount you hope to receive when the stock eventually sells.
Is a high stock turnover always good?
No. High turnover can indicate strong demand and efficient inventory use, but it can also occur alongside weak margins or insufficient stock levels. Consider turnover together with profitability and availability.
Why does the calculator annualise shorter periods?
Annualising gives you a common reference point. For example, turnover measured over three months can be converted into an annual equivalent, making different periods easier to interpret and compare.
How often should a reseller calculate stock turnover?
Active sellers may find monthly or quarterly reviews useful for spotting changes. Longer periods can provide a more stable picture when sales are seasonal or irregular.
Want Higher Profit Margins?
Get the free UK Reseller Profit Toolkit for practical help understanding your numbers, improving pricing decisions and protecting more of the profit from each sale.
Get the UK Reseller Profit Toolkit
Free practical guidance built for UK resellers.
Get the Free Toolkit